Urban Internet Infrastructure: Why Your Neighborhood’s Speed Varies
I’ve spent 15 years mapping internet speeds across cities, and let me tell you – the digital divide is real! After crawling through countless underground cable systems and scaling more utility poles than I can count, I’ve uncovered why some neighborhoods surf at lightning speed while others barely crawl.
TLDR: Why do internet speeds vary so dramatically between neighborhoods in the same city?
1️⃣ What causes internet speed differences between neighborhoods?
Infrastructure age, population density, and historical investment patterns create significant speed variations. Newer developments typically have fiber-optic cables, while older areas often rely on dated copper lines.
2️⃣ Which neighborhoods typically get the fastest internet?
Business districts and high-income residential areas usually see the latest upgrades first, followed by dense suburban areas. Competition between providers in these zones drives better service.
3️⃣ What role does infrastructure investment play?
Investment decisions by ISPs heavily impact neighborhood speeds. Areas with higher return potential get priority for expensive infrastructure upgrades like fiber deployment.
How Does Infrastructure Vary Between Neighborhoods?
When it comes to internet speeds, not all neighborhoods are created equal. I’ve seen firsthand how dramatically infrastructure can vary just by crossing a few city blocks. Let’s break down the key differences I’ve observed:
Example: Parts of Dorchester still limited to ~50 Mbps DSL
Infrastructure Layout Comparison
Component
New Development
Established Neighborhood
Older Urban Core
Last-Mile Connection
Fiber to the home
Mix of fiber/coax
Mostly copper DSL
Network Nodes
1 per 50-100 homes
1 per 200-300 homes
1 per 500+ homes
Underground Conduit
Spacious, future-ready
Limited extra capacity
Often at capacity
Utility Poles
Fewer, modern design
Mix of old and new
Crowded, aged
The differences in infrastructure lead to real-world speed variations. While mapping Cambridge, MA, I found university areas enjoying gigabit fiber, while just a mile away, older triple-deckers were limited to 100 Mbps cable plans.
If you’re curious about options in your area, checking available providers is a great first step. Remember, infrastructure is always evolving, so it’s worth rechecking periodically for new high-speed options in your neighborhood.
What Affects Infrastructure Investment Decisions?
I’ve spent countless hours analyzing the factors that drive internet infrastructure investments. Let me break down the key elements that shape these crucial decisions:
The physical act of laying new infrastructure is expensive and complicated:
Underground vs. Aerial: Running fiber underground in a place like Boston can cost up to $1 million per mile. Aerial installations on existing utility poles are cheaper but have their own challenges.
Terrain Challenges: Hilly areas or those with lots of rock, like parts of San Francisco, can dramatically increase costs.
Existing Infrastructure: It’s often cheaper to upgrade existing lines than to start from scratch. This is why you’ll see Spectrum focusing on coaxial cable upgrades in some areas.
Local Regulations: Some cities make it easier to get permits for new infrastructure. Others have strict rules that can slow down or increase the cost of projects.
Federal Initiatives: Programs like the FCC’s Connect America Fund provide incentives for rural broadband development.
Franchise Agreements: These contracts between cities and ISPs can influence where and how quickly new infrastructure is built.
The presence (or absence) of competitors affects investment strategies:
Monopoly Markets: In areas with only one provider, there’s less incentive to upgrade infrastructure quickly.
Competitive Markets: Cities with multiple providers often see faster upgrades as companies vie for customers. For example, when Fidium Fiber enters a market, it often spurs other providers to improve their offerings.
Chattanooga’s municipal broadband project is a perfect example of how these factors interplay:
The city invested $330 million in a fiber network, betting on long-term economic benefits.
This public investment spurred private companies to improve their offerings.
The result? Chattanooga now boasts some of the fastest internet speeds in the country, earning it the nickname “Gig City”.
Investment Decision Matrix
Factor
High Impact
Medium Impact
Low Impact
Population Density
Urban Centers
Suburbs
Rural Areas
Income Levels
Affluent Neighborhoods
Middle-class Areas
Low-income Zones
Existing Infrastructure
Coaxial Cable Present
Copper Phone Lines
No Existing Lines
Regulatory Support
Pro-investment Policies
Neutral Policies
Restrictive Policies
Competition
Multiple Providers
Duopoly
Monopoly
Understanding these factors helps explain why your internet options might differ from your friend’s across town. If you’re curious about what’s available in your area, check your address for the best internet options. You might be surprised at how quickly things can change as providers like Frontier, Spectrum, and Fidium continue to expand and upgrade their networks.
Which Neighborhoods Get Better Internet?
After years of mapping internet speeds across urban landscapes, I’ve noticed some clear patterns in which neighborhoods tend to get the best connections. Let’s break it down:
Primarily cable internet, some fiber slowly rolling out
Average speeds: 100 – 300 Mbps
Less frequent infrastructure investment
Speed Comparison Table
Neighborhood Type
Typical Download Speeds
Common Providers
Infrastructure
Central Business District
1 Gbps+
Frontier, Fidium, Business-focused ISPs
Extensive Fiber
Affluent Residential
500 Mbps – 1 Gbps
Frontier FiberOptic, Fidium Fiber
Fiber to the Home
Tech Hub/University Area
500 Mbps – 1 Gbps
Multiple, including Spectrum
Mix of Fiber and High-Speed Cable
New Development
300 Mbps – 1 Gbps
Varies, often Fiber-focused
Latest Tech
Dense Urban Residential
200 – 500 Mbps
Spectrum, Some Fiber
Mix of Cable and Fiber
Older Urban Residential
50 – 200 Mbps
Mostly Cable Providers
Older Cable, Some DSL
Urban Fringe/Semi-Rural
25 – 100 Mbps
Limited Options
Older Infrastructure
Remember, these are general trends. Individual experiences can vary, and the internet landscape is always evolving. If you’re curious about what’s available at your address, check your options here. You might be surprised – I’ve seen neighborhoods transform their connectivity almost overnight when a new provider like Frontier or Fidium decides to move in.
What’s Being Done to Improve Infrastructure?
The push to improve urban internet infrastructure is in full swing. I’ve been tracking these efforts closely, and it’s exciting to see the progress. Let’s dive into some of the key initiatives:
$157 million investment to bring broadband to 1.6 million New Yorkers
Partnering with multiple providers to ensure competition
Focuses on historically underserved neighborhoods in Brooklyn and The Bronx
Infrastructure Upgrade Comparison Table
Initiative
Type
Target Areas
Expected Impact
Timeline
RDOF
Government
Rural
5.2M new connections
2020-2030
BEAD Program
Government
Nationwide
Broadband for all
2022-2026
Frontier Fiber
Private
Urban/Suburban
10M fiber locations
By 2025
Spectrum DOCSIS 3.1
Private
Existing Markets
Gigabit speeds widely available
Ongoing
Fidium Fiber
Private
Northeast U.S.
Expanding fiber footprint
Rapid expansion
Municipal Networks
Community
Various Cities
Affordable gigabit service
Varies by city
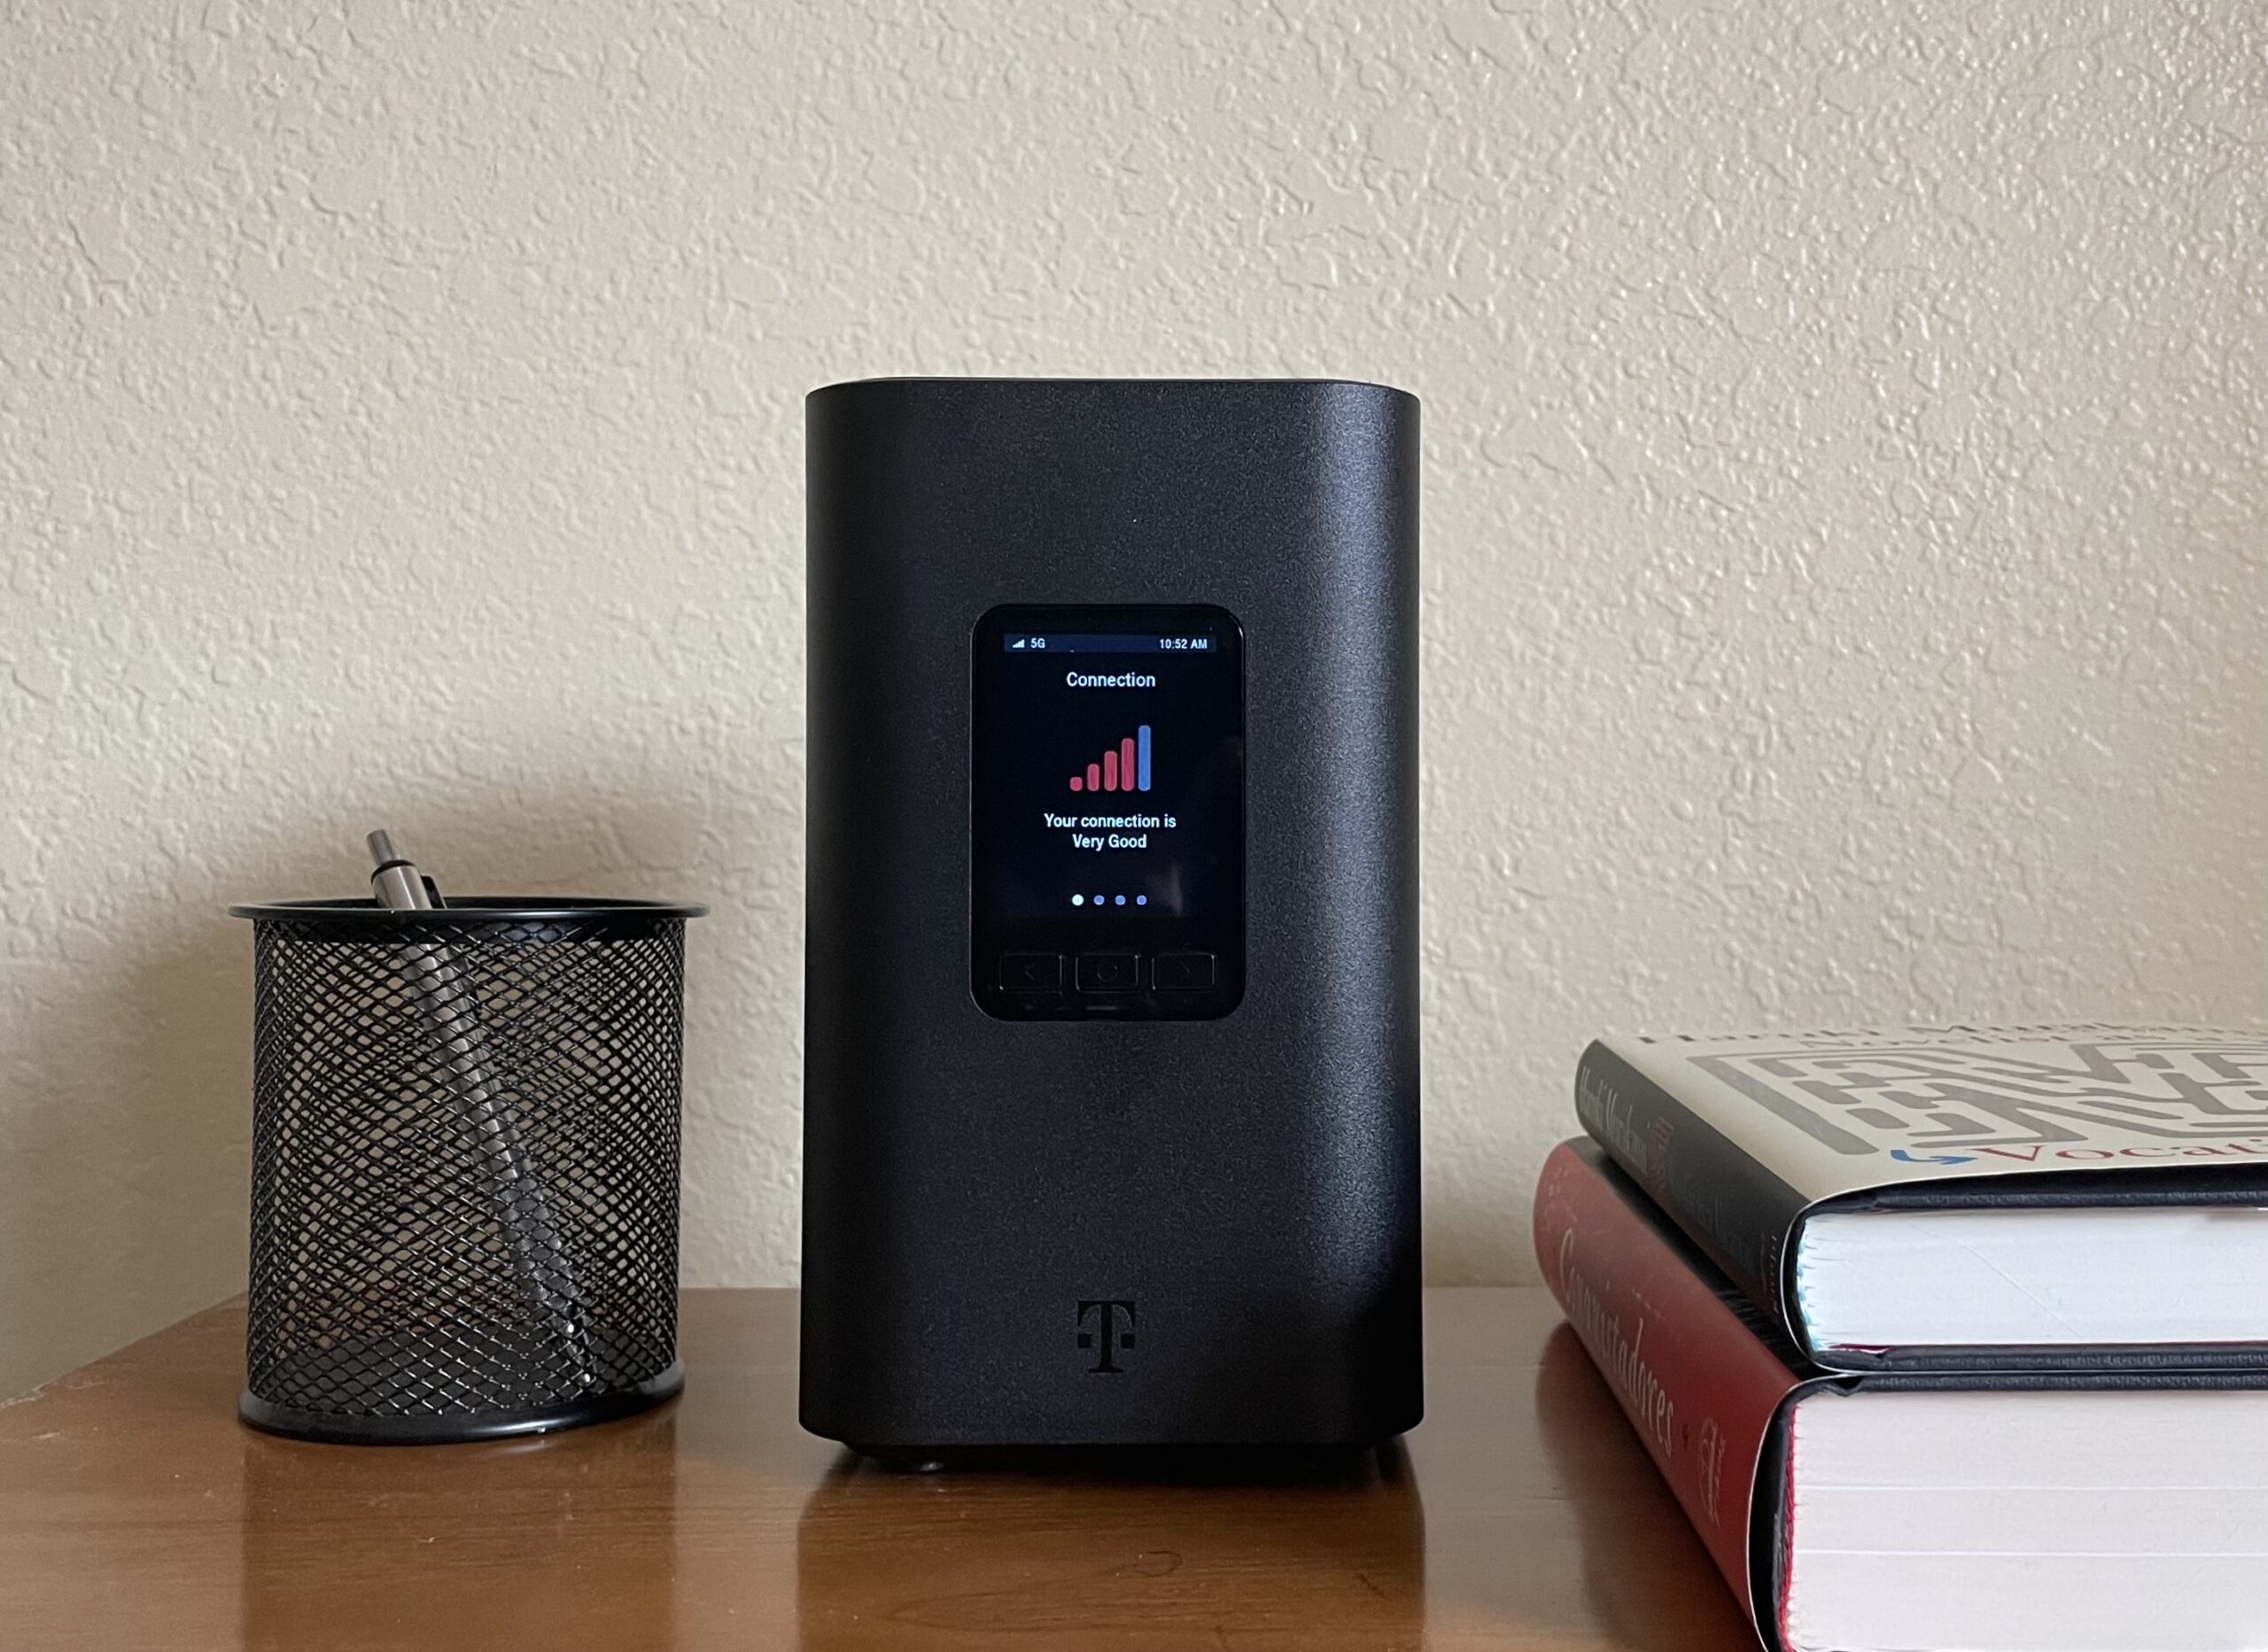
5G Fixed Wireless
Emerging Tech
Urban/Suburban
Alternative to wired broadband
Rolling out now
These initiatives are reshaping the urban internet landscape. In Charlotte, North Carolina, I’ve watched neighborhoods transform from having only one slow DSL option to multiple gigabit choices in just a couple of years.
If you’re curious about what’s happening in your area, it’s worth checking your address for new options. The internet infrastructure landscape is changing rapidly, and you might be surprised at what’s now available.
Remember, improving infrastructure takes time, but the pace of change is accelerating. Keep an eye out for construction crews and new equipment on utility poles – they might be bringing faster internet to your neighborhood soon!
How Can You Check Your Neighborhood’s Infrastructure?
Curious about the internet infrastructure in your area? I’ve spent years digging into this stuff, and I’ll share some insider tips to help you become a neighborhood internet detective. Let’s explore how you can uncover the digital backbone of your community:
Contributes to a global database of internet performance
Infrastructure Assessment Table
Method
What to Look For
What It Tells You
Reliability
FCC Map
Available providers and speeds
Official reported coverage
Moderate – can be outdated
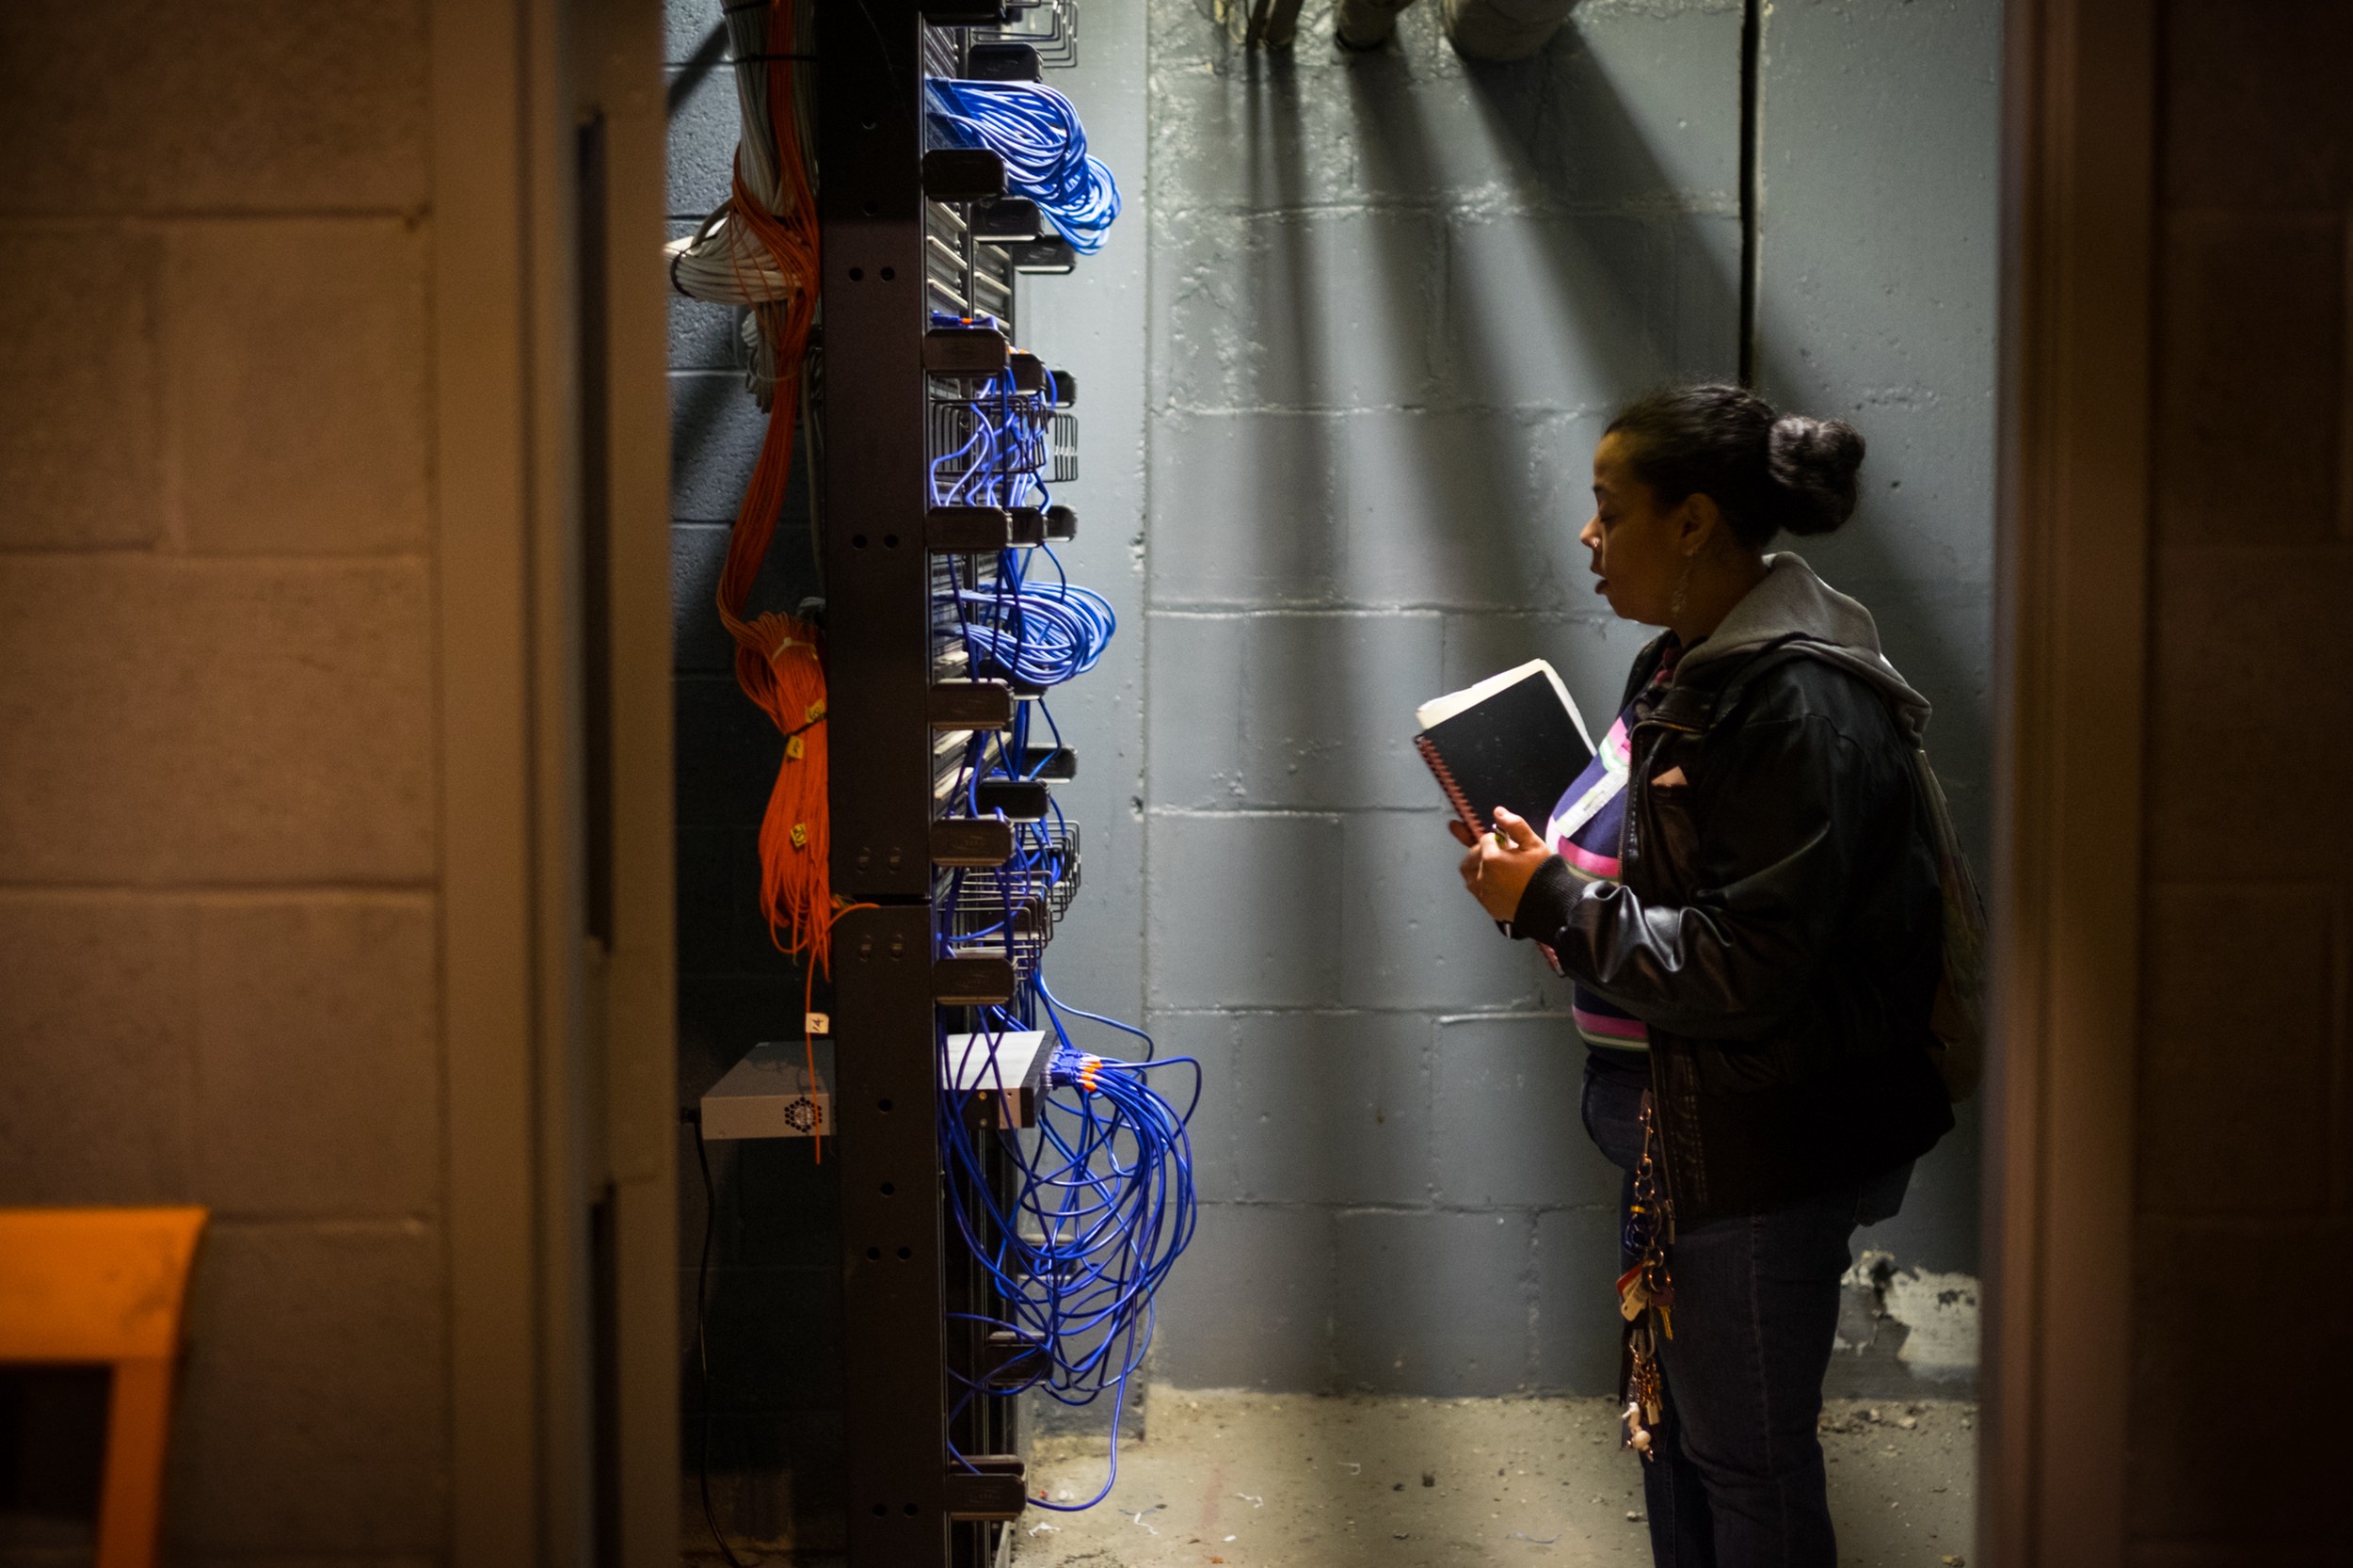
Physical Inspection
Fiber cables, equipment boxes
Type of infrastructure present
High – if you know what to look for
ISP Checker
Offered speeds and technology
Current service options
High – directly from providers
Speed Tests
Actual speeds vs. advertised
Real-world performance
High – but can vary
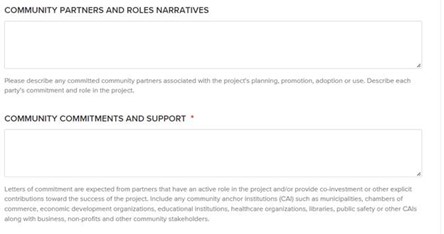
Local Gov’t Data
Permit info, public works projects
Upcoming improvements
High – but may require interpretation
Case Study: My Neighborhood Deep Dive
Last year, I decided to map out the internet infrastructure in my Philadelphia neighborhood. Here’s what I found:
Utility pole survey revealed new fiber installations by Frontier
City records showed permits for extensive conduit work
Neighbors reported Spectrum trucks upgrading local nodes
Speed tests showed a 300% increase in average speeds over 6 months
The result? We went from having just basic cable to multiple gigabit options. It pays to stay informed!
Remember, internet infrastructure is constantly evolving. What’s true today might change tomorrow. Keep checking your address for new options – you might be surprised at how quickly things improve.
By combining these methods, you’ll get a comprehensive picture of your neighborhood’s internet landscape. Happy investigating!